Holding time, daily reset and risk
How Long Can You Hold a Leveraged ETF?
There is no rule that says you must sell after one day. But a leveraged ETF sets its target for each trading day. If you hold it longer, the result depends on every daily move along the way. It will not simply be two or three times the index return.
Reviewed August 20, 2026. Educational information, not personal financial advice.
Why the result changes after the first day
The fund starts each trading day with a new value and sets its leverage again. This is called a daily reset. Because of it, the order of gains and losses matters.
The SEC gives a simple example. An index falls from $1,000 to $900. The next day it rises by 10% to $990. The index has lost 1% over two days. A daily 2× fund falls from $1,000 to $800. It then rises by 20% to $960. It has lost 4%, even though it reached its 2× target on both days.
This daily linking of returns is called compounding. Frequent moves up and down can hurt the result. A steady trend can sometimes help it. This is why a 2× ETF does not simply give twice the long-term index return.
Holding it longer is not automatically safer
The number of days alone does not decide the risk. A week with large moves up and down can do more damage than several calm months. More leverage, larger price swings, higher costs and a bigger gap between the fund and its target can all make the result worse.
FINRA says daily-reset leveraged and inverse ETFs are usually not suitable as medium- or long-term investments. It also notes that some closely watched trading or hedging plans may hold them for longer. Hedging means using an investment to reduce another risk. This is a warning, not a rule that everyone must sell at the end of each day.
Five checks before holding for longer
- Read the fund's official documents. Check its daily target, index, costs and main risks. Do not assume that every leveraged ETF works in the same way.
- Check what the fund follows. A broad stock index is different from one company, one sector, a commodity or crypto. A narrow target can move much more sharply.
- Test many start dates. One good chart can hide bad periods. Check the worst loss from an earlier high, how long recovery took and how often the investment ended below its starting value.
- Include all costs. Look at the fund fee, borrowing costs, trading costs, taxes and the gap between the target and the fund's real return.
- Set limits before you buy. Decide when you will review or close the position. A daily-reset fund should not become a forgotten investment.
What the long-term chart can and cannot show
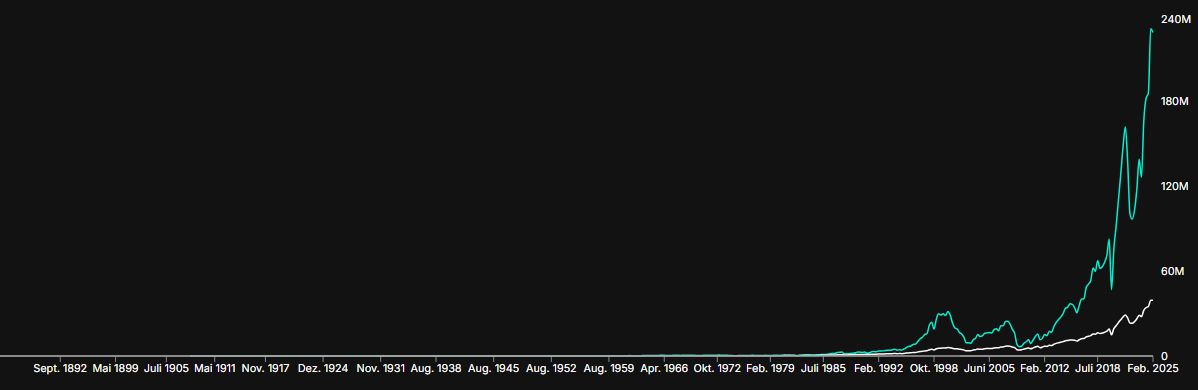
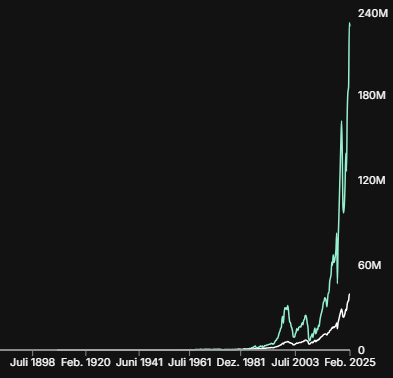
Our chart applies a simple daily 2× model to S&P 500 Total Return data back to 1885. It does not show the real history of SSO, which started in 2006. A model cannot include every real fund cost, tax, trading limit or risk that a fund may close.
The most useful part is not the final value from one start date. It is the difficult path. The model includes a fall of almost 99%, recovery periods lasting many years and long periods with weaker returns. A strategy can survive in a model and still be too hard to hold in real life.
Academic research reaches a similar result. Over several days, both the total index return and the size of its daily moves matter. The exact order of those moves matters too.
Avellaneda and Zhang: Path-Dependence of Leveraged ETF Returns